New Product Launch | Insights from our Data Team | OpticOdds Out of the House | OpticOdds Team Continues to Grow | Coverage Upgrades
New Product Launch:
Excited to announce that our newest product launch COPILOT, is now live with select early partners.
The ultimate wingman to your sportsbook. Copilot is a next-generation automated trading solution that allows sportsbooks to increase scale, efficiency and profitability. Book a demo today.
Insights:
How do NFL spreads align with outcomes of the game? Our data team scoured over 4000 games find out…
Out of the House
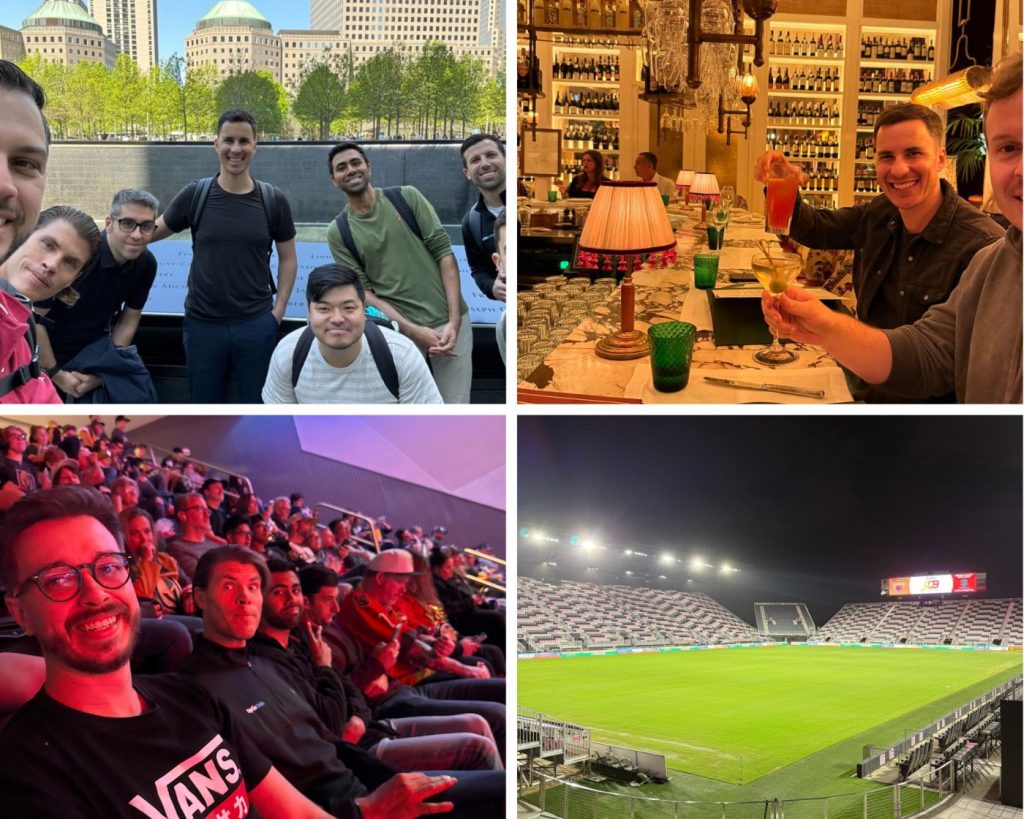
The OpticOdds team have had a busy month, establishing new relationships with prospects and partners and finding every opportunity to get together for a strategic session (or just a happy hour).
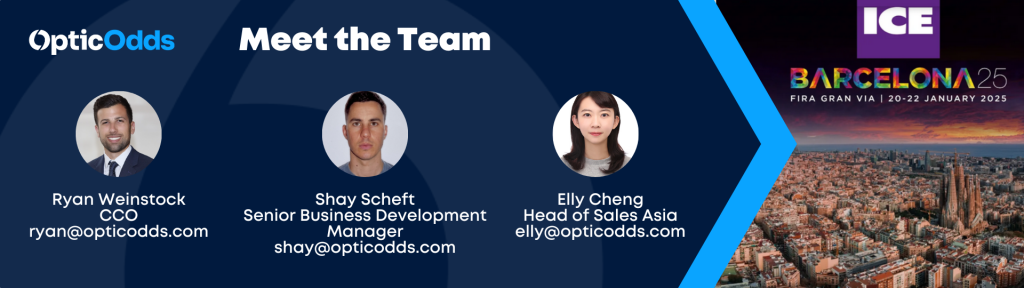
ICE 2025
The OpticOdds team will be in Barcelona for the first ever European edition of the ICE 2024 expo. If any readers would like to link up for chat, please reach out!
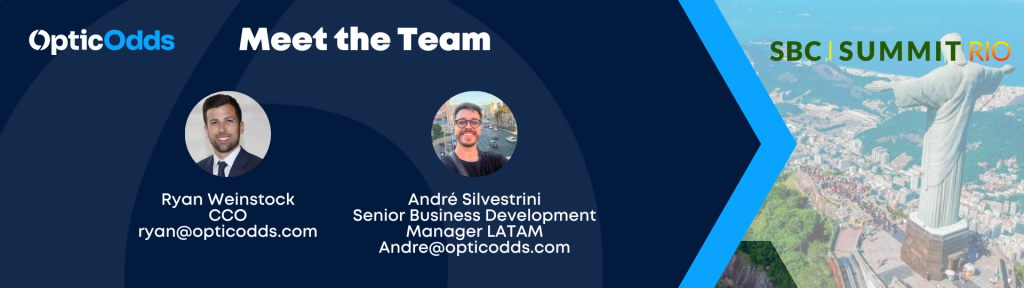
SBC Rio 2025
Did you know Rio De Janeiro means ‘River of January’? Me neither.. But our native Portuguese speaker and new LATAM sales lead Andre Silvestrini sure did. Andre and CCO Ryan Weinstock will be heading to SBC Rio excited to meet with prospects and meet some new faces. Get in touch for a meeting
OpticOdds Team Continues to Grow:
We’ve had an incredibly productive month welcoming new talent to the OpticOdds team, bringing in expertise and experience to help us solidify our growth ambitions in key markets…
Over in Asia, Elly Cheng is taking the lead on regional partnerships.
In LATAM, André Lucas Silvestrini is deepening relationships with a number of key partners.
Matthew Cullen joins as an advisor bringing 20+ years of gaming wisdom from places like BetPARX and Paddy Power Betfair. Whether for startups or public companies, he’s built teams that win.
Samuel Hill joins from Playnetic, where he crushed it in global B2B marketing.
In EMEA, Shay Scheft is spearheading partnerships that drive tangible returns — the kind that boost operator efficiency.
Every new hire moves us closer to our goal: helping sportsbooks scale efficiently across every major market.
Coverage Upgrades:
Our data team have had a huge month expanding our sportsbook API coverage with :
New futures markets for:
Premier League | La Liga | Ligue 1 | Bundesliga | EuroLeague | Champions League | Europa Conference League | Europa League | NBA | NHL
Expanded Coverage for:
FIBA | FIFA World Cup Qualifiers | NHL | NCAAB | NCAAF & NBA Player Props